Rerurn to Romy the Cat's Site
In the Forum: Horn-Loaded Speakers
In the Thread: Evaluation of tractrix curves based on visual surface reflections.
Post Subject: Evaluation of tractrix curves based on visual surface reflections.Posted by jessie.dazzle on: 6/20/2006
I have been working on curves for tractrix horns based on data generated by HornCalc software. I configured the software to give values corresponding to radial sections for every 10mm of axial length of a horn nearly 1 meter long.
When I plot the curve, I get something that, at a glance, looks correct.
The CAD software I used to plot the actual curve (and later, to create the numerical data for the inner surface of the horn) has a feature for checking curvature continuity ; this is an evaluation tool that allows easy visualization of a curves progressive evolution… It is intended to insure accurate control of visual reflections in surfacing objects having a very high-gloss finish.
Applying the evaluation tool to the curve plotted with points every 10mm; the results indicate a somewhat non curvature-continuous curve. This is to be expected, as the curve has been generated using far too many points…91 to be precise ; each one corresponding to the 91 points supplied by the horn calculation software. For a curve like this, I would normally use something like 5 or 6 points.
Simply by reducing the points, I get better results from the evaluation tool, but still not at all what I would call good continuity.
Because visual reflections seem likely to bear some relationship to sonic reflections, I decided to perfect the curve as I would if surfacing for perfect visual reflections, while staying as close as possible to the points supplied by the horn calculation software. In the end, I was able to achieve very satisfactory results with a max of 7mm deviation from the original data (remember, this is relative to a length of nearly 1 meter).
I have included accompanying screen dumps of the process :
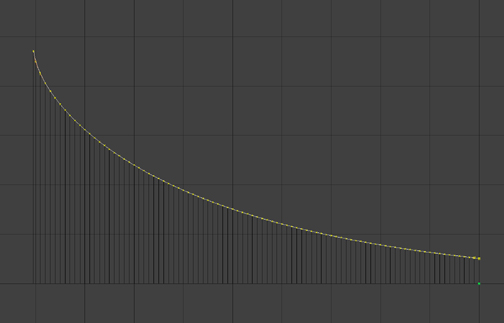
Image 1 : The curve plotted with all 91 points as given by horn calculation software
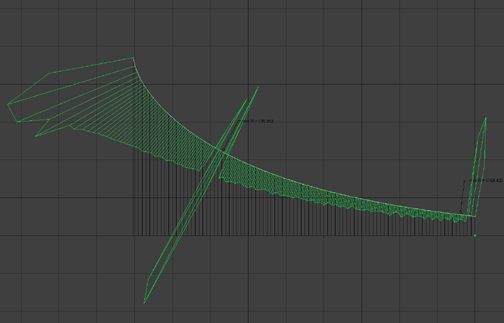
Image 2 : The same curve under evaluation
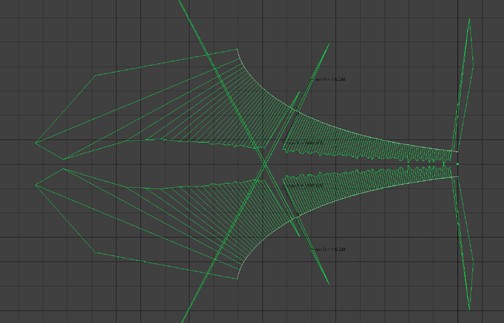
Image 3 : The same curve under evaluation ; this time mirrored
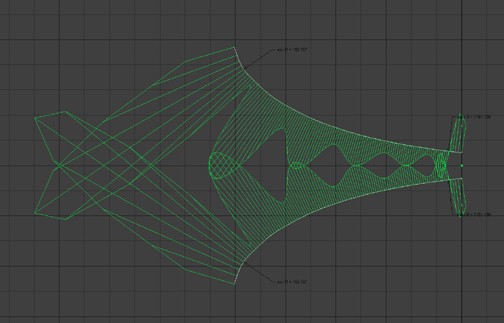
Image 4 : The same curve after having undergone a substantial reduction in the number of points (no other corrective adjustment applied)… note the kink near the mouth, and how the evaluation tool points it out with an arrow, and the accompanying suddenly much longer radiating lines… Also interesting is the inversion in the throat
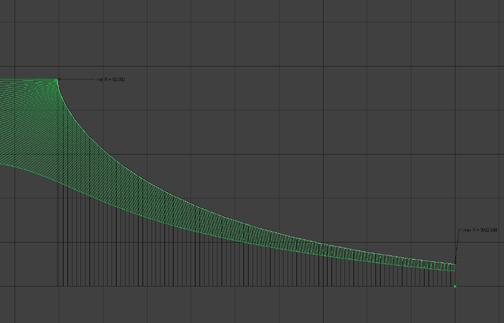
Image 5 : Same curve after some manual adjustment
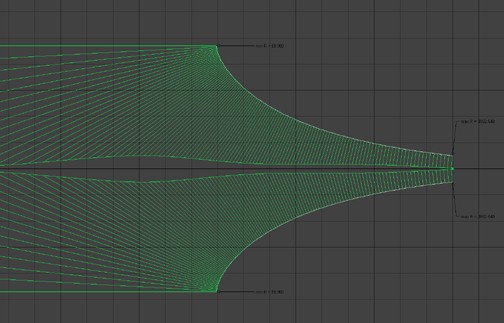
Image 6 : More manual adjustment
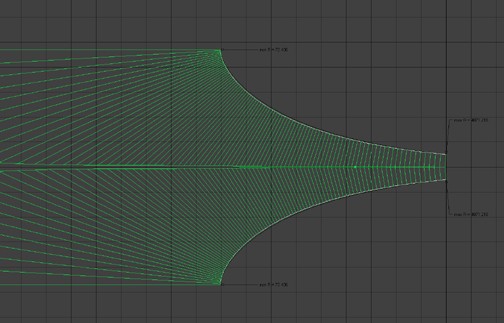
Image 7 : Final manual adjustment
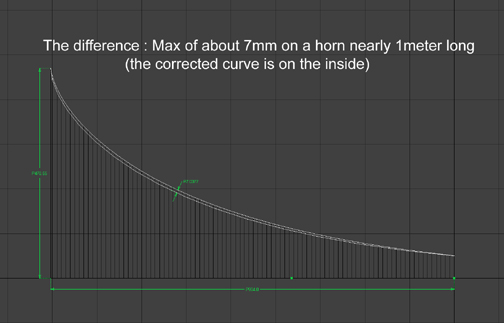
Image 8 : Comparison to the original 91 point curve
It is interesting to note that the evaluation tool shows lines radiating perpendicular to the curve at any given point, just as the sound wave is supposed to be oriented as it progresses along the horns length.
Based on these observations, I am very tempted to build the horns according to this “perfected” curve… But before I do, I would be curious to get feedback from those having more experience on the subject.
Thank you in advance,
jd*